Scatter Plots
Grade 8 Math Worksheets
In statistics, a Scatter plot or a Scatter diagram is a graph plotted for two variables, taking one variable along the horizontal axis i.e. X-axis & the other variable along the vertical axis i.e. the Y-axis. Generally, the independent variable is taken along the X-axis & the dependent variable is taken along they axis. It helps us to find whether the two variables, say x & y are correlated or not.

If two variables are correlated, then let’s see how they are related.
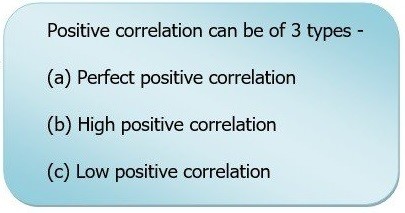
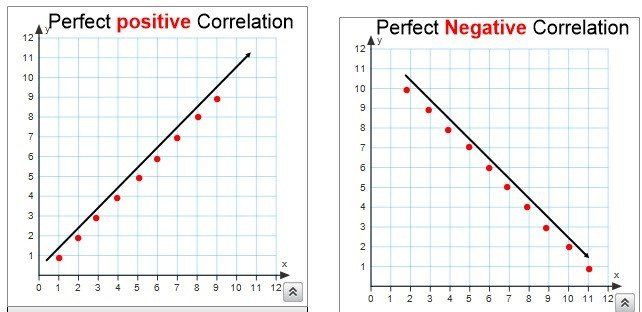
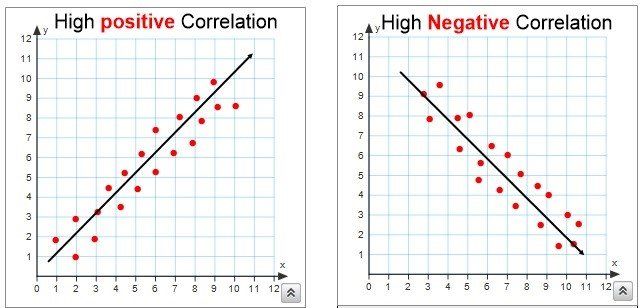
- If the pattern of the plotted points moves from bottom to top as we move from left to right on the X-axis, then it means the value of y increases as the value of x increases. Hence, there exists a positive correlation among the variables x & y and the graph is seen to be rising above
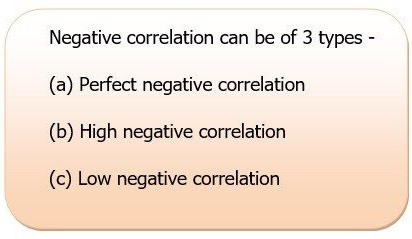
- If the pattern of the plotted points moves from top to bottom to top as we move from left to right on the X axis, then it means the value of y decreases as the value of x increases. Hence, there exists a negative correlation among the variables x & y and the graph is seen to be falling down.
- If the values of y do not change, as we move from left to right on the X axis, then it means the value of y is constant as the value of x increases. Hence, there exists a correlation among the variables x & y is constant
- If the pattern of the plotted points does not show a recognizable pattern e. shows a random behaviour as we move from left to right on the X axis, then the two variables are uncorrelated.
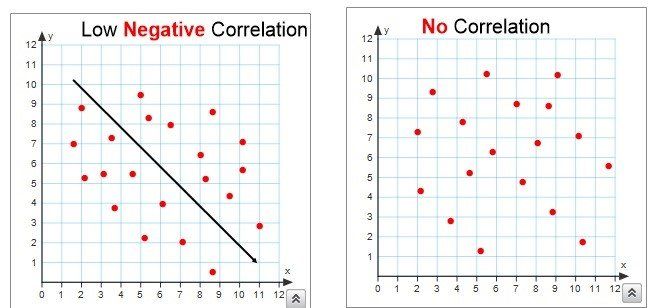
Now, we consider some examples.
Example 1: Draw a scatter plot for the following set of values of x & y and identify if they are correlated. If yes, specify the type of correlation present.
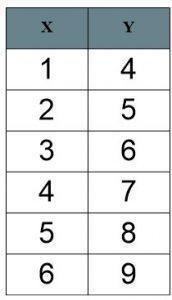
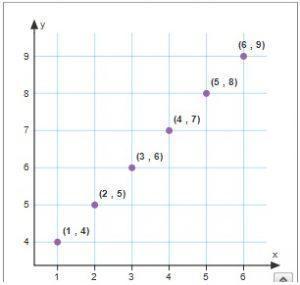
The scatter plot clearly shows that graph rises down as the values of x are increased i.e. as we move from left to right on the x axis. Hence the variables x & y are positively correlated.
Since all the points can be joined by a line, hence the correlation is a perfect positive correlation.
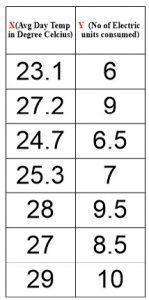
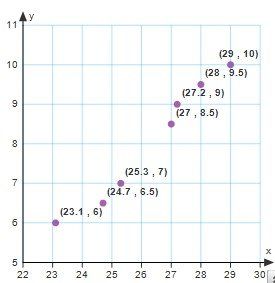
Example 2: A company keeps a record of the number of electric units consumed in seven days of a week with respect to the average day temperature.
Construct a scatter plot for the same and check if there exists a relation between the average day temperature & the number of electric units consumed on that day.
The scatter plot clearly shows that graph rises above as the values of x are increased i.e. as we move from left to right on the x axis. Hence the variables x & y are positively correlated.
Since all the points can’t be joined exactly by a line, hence the correlation is a high positive correlation. So, the number of electric units consumed is having a high positive correlation with the average day temperature.
Example 3: Draw a scatter plot for the following set of values of x & y and identify if they are correlated. If yes, specify the type of correlation present.
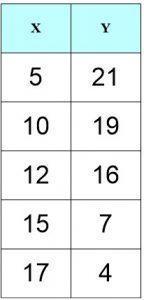
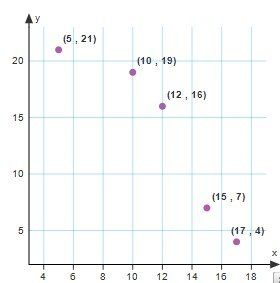
The scatter plot clearly shows that graph rises down as the values of x are increased i.e. as we move from left to right on the x axis. Hence the variables
x & y are negatively correlated. Since all the points can’t be joined exactly by a line, hence the correlation is a high negative correlation.
From the above example, we see that the scatter plot is a graph plotted between the two variables which give us information, about the correlation between the two variables involved.
Check Point
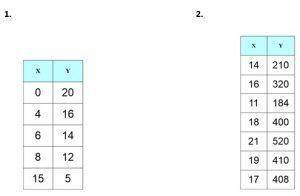
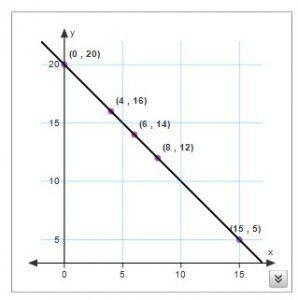
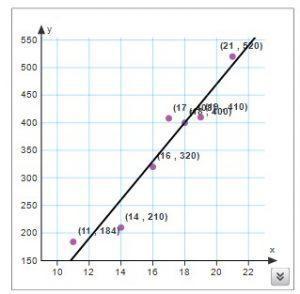
Construct the scatter plots for the following given set of values & identify the type of correlation (if it exists) .
Answer key
- Perfect Negative correlation
- High Positive correlation
Personalized Online Tutoring
eTutorWorld offers affordable one-on-one live tutoring over the web for Grades 2-12, Test Prep help for Standardized tests like SCAT, CogAT, SSAT, SAT, ACT, ISEE and AP. You may schedule online tutoring lessons at your personal scheduled times, all with a Money-Back Guarantee. The first one-on-one online tutoring lesson is always FREE, no purchase obligation, no credit card required.
For answers/solutions to any question or to learn concepts, take a FREE Demo Session.
No credit card required, no obligation to purchase.
Just schedule a FREE Sessions to meet a tutor and get help on any topic you want!
Pricing for Online Tutoring
| Tutoring Package | Validity | Grade (1-12), College |
|---|---|---|
| 5 sessions | 1 Month | $139 |
| 1 session | 1 Month | $28 |
| 10 sessions | 3 months | $269 |
| 15 sessions | 3 months | $399 |
| 20 sessions | 4 months | $499 |
| 50 sessions | 6 months | $1189 |
| 100 sessions | 12 months | $2249 |
IN THE NEWS

Our mission is to provide high quality online tutoring services, using state of the art Internet technology, to school students worldwide.
Online test prep and practice
SCAT
SSAT
ISEE
PSAT
SAT
ACT
AP Exam
Science Tutoring
Physics Tutoring
Chemistry Tutoring
Biology Tutoring
Math Tutoring
Pre-Algebra Tutoring
Algebra Tutoring
Pre Calculus Tutoring
Calculus Tutoring
Geometry Tutoring
Trigonometry Tutoring
Statistics Tutoring
Quick links
Free Worksheets
Fact sheet
Sales Partner Opportunities
Parents
Passive Fundraising
Virtual Fundraising
Our Expert Tutors
Safe and Secure Tutoring
Interactive Online Tutoring
After School Tutoring
Elementary School Tutoring
Middle School Tutoring
High School Tutoring
Home Work Help
Math Tutors New York City
Press
©2022 eTutorWorld Terms of use Privacy Policy Site by Little Red Bird
©2022 eTutorWorld
Terms of use
Privacy Policy
Site by Little Red Bird
