Reading Bar Charts
Grade 6 Math Worksheets
What is a bar diagram with an example?
A bar graph or bar chart is used to show information using bars in a graph for the representation of numbers.
Any given statistical data with a range can be depicted on a bar graph. Read here how to read histograms.
Example 1
A, B, C and D are the candidates who stood for an election in specific territory. Represent the one who won with the highest votes on a bar graph.
- 15 votes
- 25 votes
- 12 votes
- 30 votes
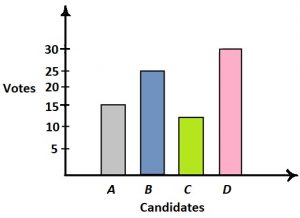
- The highest votes were gained by D, represented in pink in the bar graph.
- The least votes were received by C, represented in green.
Such pictorial representation is helpful when we have a large data to look at then this makes the data quite understandable.
Example 2
This bar chart shows the no. of students and their interest levels in various subjects.
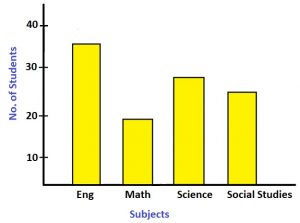
- Which is the most popular subject?
- Which is the least popular subject?
Solution
- English is the most popular subject.
- Math is the least popular.
Check Point
- The no. of toys manufactured by a toy factory is given below according to 5 consecutive months. Draw a bar graph representing the following data
| Number Of Toys | Months |
| 200 | Sep |
| 350 | Oct |
| 400 | Nov |
| 100 | Dec |
| 500 | Jan |

- The following table shows the points scored by 6 different teams in soccer in the soccer tournament. Draw a bar graph and highlight the winning team.
| Teams | Points |
| Napa valley | 48 |
| North Carolina | 60 |
| Texas | 48 |
| New jersey | 12 |
| California | 28 |
| Colorado | 36 |
- Which are teams who are in a tie?
- Who has more chances of winning the tournament?
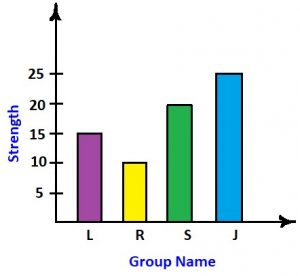
- The following are the no of kids studying in a kindergarten school. Depict this in a bar graph.

| Group Name | Strength |
| Lily | 15 |
| Rose | 10 |
| Sunflower | 20 |
| Jasmine | 25 |
Answer key
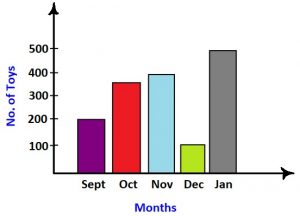
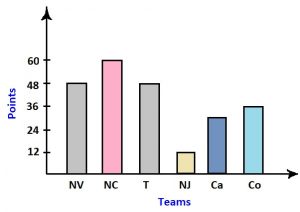
The winning team is North Carolina.
- The teams that are in tie are Napa valley and Texas.
- The team which has more chances for winning is North Carolina.
- The following graph depicts the strength in various groups of kindergarten.
Personalized Online Tutoring
eTutorWorld offers affordable one-on-one live tutoring over the web for Grades 2-12, Test Prep help for Standardized tests like SCAT, CogAT, SSAT, SAT, ACT, ISEE and AP. You may schedule online tutoring lessons at your personal scheduled times, all with a Money-Back Guarantee. The first one-on-one online tutoring lesson is always FREE, no purchase obligation, no credit card required.
For answers/solutions to any question or to learn concepts, take a FREE Demo Session.
No credit card required, no obligation to purchase.
Just schedule a FREE Sessions to meet a tutor and get help on any topic you want!
Pricing for Online Tutoring
| Tutoring Package | Validity | Grade (1-12), College |
|---|---|---|
| 5 sessions | 1 Month | $139 |
| 1 session | 1 Month | $28 |
| 10 sessions | 3 months | $269 |
| 15 sessions | 3 months | $399 |
| 20 sessions | 4 months | $499 |
| 50 sessions | 6 months | $1189 |
| 100 sessions | 12 months | $2249 |
IN THE NEWS

Our mission is to provide high quality online tutoring services, using state of the art Internet technology, to school students worldwide.
Online test prep and practice
SCAT
SSAT
ISEE
PSAT
SAT
ACT
AP Exam
Science Tutoring
Physics Tutoring
Chemistry Tutoring
Biology Tutoring
Math Tutoring
Pre-Algebra Tutoring
Algebra Tutoring
Pre Calculus Tutoring
Calculus Tutoring
Geometry Tutoring
Trigonometry Tutoring
Statistics Tutoring
Quick links
Free Worksheets
Fact sheet
Sales Partner Opportunities
Parents
Passive Fundraising
Virtual Fundraising
Our Expert Tutors
Safe and Secure Tutoring
Interactive Online Tutoring
After School Tutoring
Elementary School Tutoring
Middle School Tutoring
High School Tutoring
Home Work Help
Math Tutors New York City
Press
©2022 eTutorWorld Terms of use Privacy Policy Site by Little Red Bird
©2022 eTutorWorld
Terms of use
Privacy Policy
Site by Little Red Bird


