Making Predictions for Probability
Grade 7 Math Worksheets
When making predictions, it’s often useful to include a measure of the uncertainty or confidence in the prediction. This is where probability comes in. Probability is a measure of the likelihood of an event occurring, expressed as a number between 0 and 1, where 0 indicates that the event is impossible and 1 indicates that the event is certain.
Table of Contents:
- Making Predictions with Probability
- Formula
- Examples
- FAQs
Personalized Online Tutoring
Making Predictions for Probability - Grade 7 Math Worksheet PDF
This is a free worksheet with practice problems and answers. You can also work on it online.
Sign up with your email ID to access this free worksheet.
"We really love eTutorWorld!"
"We really love etutorworld!. Anand S and Pooja are excellent math teachers and are quick to respond with requests to tutor on any math topic!" - Kieran Y (via TrustSpot.io)
"My daughter gets distracted easily"
"My daughter gets distracted very easily and Ms. Medini and other teachers were patient with her and redirected her back to the courses.
With the help of Etutorworld, my daughter has been now selected in the Gifted and Talented Program for the school district"
- Nivea Sharma (via TrustSpot.io)
Making Predictions with Probability
When making predictions, it’s often useful to include a measure of the uncertainty or confidence in the prediction. This is where probability comes in. Probability is a measure of the likelihood of an event occurring, expressed as a number between 0 and 1, where 0 indicates that the event is impossible and 1 indicates that the event is certain.
When making predictions with probability, we start by defining an event of interest. For example, we might want to predict the likelihood of a particular stock price increasing by a certain amount in the next month. We then gather data relevant to the event, such as historical stock prices, economic indicators, news articles, and so on.
Based on this data, we can use statistical methods to estimate the probability of the event occurring. For example, we might use a regression model to predict the stock price change based on historical data and economic indicators. The output of the model will typically be a probability estimate of the event occurring, such as “there is a 70% chance of the stock price increasing by at least 5% in the next month.”
It’s important to note that probability estimates are not perfect, and there is always some uncertainty involved. For example, the actual stock price change may be affected by factors that were not included in the model, such as unexpected news events or changes in market sentiment. Therefore, it’s important to interpret probability estimates with caution and to consider the potential sources of uncertainty.
Formula for Predictions with Probability
There are different methods and formulae for making predictions with probability depending on the type of data and the specific problem being addressed. Here are a few commonly used approaches:
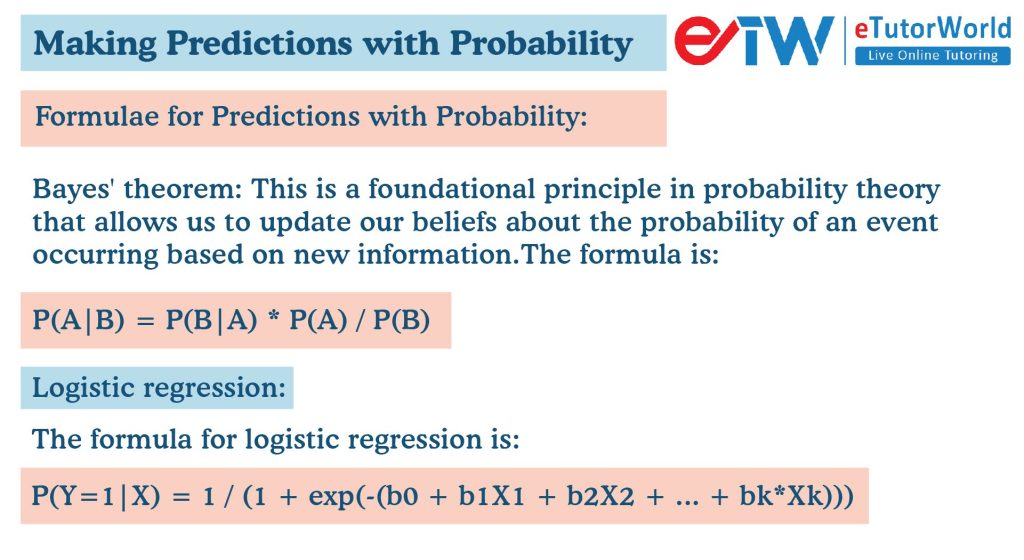
Bayes’ theorem: This is a foundational principle in probability theory that allows us to update our beliefs about the probability of an event occurring based on new information. The formula is:
P(A|B) = P(B|A) * P(A) / P(B)
where P(A) is the prior probability of event A, P(B) is the prior probability of event B, P(B|A) is the likelihood of observing event B given that event A has occurred, and P(A|B) is the posterior probability of event A given that event B has been observed.
Logistic regression: This is a statistical model that is commonly used for predicting binary outcomes (i.e., outcomes that can take on only two values, such as yes or no). The formula for logistic regression is:
P(Y=1|X) = 1 / (1 + exp(-(b0 + b1X1 + b2X2 + … + bk*Xk)))
where Y is the binary outcome variable, X1, X2, …, Xk are the predictor variables, b0, b1, b2, …, bk are the coefficients estimated from the data, and exp() is the exponential function.
Naive Bayes classification: This is a simple probabilistic algorithm that is commonly used for text classification problems. The formula is:
P(C|X) = P(X|C) * P(C) / P(X)
where C is the class (i.e., the category of text), X is the input text, P(X|C) is the likelihood of observing text X given that it belongs to class C, P(C) is the prior probability of class C, and P(X) is the overall probability of observing text X.
Decision trees: This is a machine learning algorithm that is commonly used for classification and regression problems. The formula involves recursively partitioning the data into subsets based on the values of predictor variables and using simple rules to make predictions in each subset.
These are just a few examples of the many methods and formulae for making predictions with probability. The choice of method will depend on the specific problem being addressed and the nature of the data.
“There have been times when we booked them last minute, but the teachers have been extremely well-prepared and the help desk at etutorworld is very prompt.
Our kid is doing much better with a higher score.”
7th Grade Tutoring
eTutorWorld offers Personalized Online Tutoring for Math, Science, English, and Standardised Tests.
Our Tutoring Packs start at just under $22.49 per hour, and come with a moneyback guarantee.
Schedule a FREE Trial Session, and experience quality tutoring for yourself. (No credit card required.)
Examples of Making Predictions with Probability
Here are a few examples of making predictions with probability:
Predicting the likelihood of a customer buying a product: Suppose we want to predict the likelihood of a customer buying a product based on their demographic information and browsing behavior. We can use logistic regression to estimate the probability of a purchase given the customer’s age, gender, income, and the number of times they visited the product page. For example, we might find that a 30-year-old female with a high income who has visited the product page three times has a 75% chance of making a purchase.
Predicting the outcome of a sports game: Suppose we want to predict the outcome of a football game based on the performance of the teams in previous games, their current ranking, and the weather conditions on the day of the game. We can use a decision tree algorithm to estimate the probability of each team winning the game based on these factors. For example, we might find that if the home team is ranked higher than the visiting team and the weather is clear, the home team has a 70% chance of winning the game.
Predicting the risk of a patient developing a disease: Suppose we want to predict the risk of a patient developing a particular disease based on their medical history and lifestyle factors. We can use a naive Bayes algorithm to estimate the probability of the patient developing the disease based on factors such as age, family history, smoking status, and exercise habits. For example, we might find that a 50-year-old patient with a family history of the disease, who is a smoker and doesn’t exercise regularly, has a 60% chance of developing the disease in the next five years.
These are just a few examples of how probability can be used to make predictions in different domains.
Do You Stack Up Against the Best?
If you have 30 minutes, try our free diagnostics test and assess your skills.
FAQS
What is probability?
Probability is a measure of the likelihood of an event occurring, expressed as a number between 0 and 1, where 0 indicates that the event is impossible and 1 indicates that the event is certain.
How is probability used in making predictions?
Probability is used to estimate the likelihood of an event occurring, which can then be used to make predictions. For example, we might use probability to predict the likelihood of a particular stock price increasing by a certain amount in the next month, or the likelihood of a patient developing a particular disease based on their medical history.
What are some common methods for making predictions with probability?
Some common methods for making predictions with probability include Bayes’ theorem, logistic regression, naive Bayes classification, and decision trees.
How do I interpret probability estimates?
Probability estimates should be interpreted with caution, as there is always some uncertainty involved. It’s important to consider the potential sources of uncertainty and to understand the limitations of the data and the methods used to estimate the probabilities.
What are some applications of making predictions with probability?
Predictions with probability have many applications in fields such as finance, healthcare, sports, and marketing. For example, probability can be used to predict stock prices, diagnose diseases, forecast the outcome of sports games, and target marketing campaigns to specific customer segments.

Gloria Mathew writes on math topics for K-12. A trained writer and communicator, she makes math accessible and understandable to students at all levels. Her ability to explain complex math concepts with easy to understand examples helps students master math. LinkedIn
Affordable Tutoring Now Starts at Just $22.49
eTutorWorld offers affordable one-on-one live tutoring over the web for Grades K-12. We are also a leading provider of Test Prep help for Standardized Tests (SCAT, CogAT, MAP, SSAT, SAT, ACT, ISEE, and AP).
What makes eTutorWorld stand apart are: flexibility in lesson scheduling, quality of hand-picked tutors, assignment of tutors based on academic counseling and diagnostic tests of each student, and our 100% money-back guarantee.


Whether you have never tried personalized online tutoring before or are looking for better tutors and flexibility at an affordable price point, schedule a FREE TRIAL Session with us today.
*There is no purchase obligation or credit card requirement
Grade 7 Science Worksheets
- Elements and Compounds
- Solar Energy
- Photosynthesis
- Electricity and Magnetism
- Law of conservation of energy
- Periodic table
- Properties of Matter
- Waves
- Energy Resources
- Weather and Climate
- Immune, Circulatory and Digestive Systems
- Organs in Multi-cellular Organism
- Sedimentary, Igneous, and Metamorphic Rocks
- Structure of the Earth
- Law of Conservation of Mass
- Physical and Chemical Changes
- Scientific Method
- Human Digestive System
- Environmental Science
- Renewable and Non-renewable energy Resources
- Characteristics of Living Organisms
- Life Science
- Earth and Space Science
- Solar Eclipse
- Heat Technology
- Newton’s Laws of Motions
- Physical Science
- Tools, Measurement and SI Units
- Earth Atmosphere
- Interactions of Living things
- The Earth Ecosystem
- Organelles in Plant and Animal cells
- Layers of the Earth
- Cycles in Nature
Grade 7 Math Worksheets
- Fractions
- Linear equations word problems
- Statistics
- Properties of Parallel Line
- Finding slope from an equation
- Identifying Quadrilaterals
- Percent Change
- Properties of addition and multiplication
- Pythagorean Theorem
- Solving two step inequalities
- Symmetry
- Fractions to Decimals (New)
- Whole Number Exponents with Integer Bases (New)
- Adding and Subtracting Fractions (New)
- Integer Addition and Subtraction (New)
- Dividing Mixed Numbers (New)
- Basics of Coordinate Geometry (New)
IN THE NEWS


Our mission is to provide high quality online tutoring services, using state of the art Internet technology, to school students worldwide.

Online test prep and practice
SCAT
SSAT
ISEE
PSAT
SAT
ACT
AP Exam
Science Tutoring
Physics Tutoring
Chemistry Tutoring
Biology Tutoring
Math Tutoring
Pre-Algebra Tutoring
Algebra Tutoring
Pre Calculus Tutoring
Calculus Tutoring
Geometry Tutoring
Trigonometry Tutoring
Statistics Tutoring
Quick links
Free Worksheets
Fact sheet
Sales Partner Opportunities
Parents
Passive Fundraising
Virtual Fundraising
Our Expert Tutors
Safe and Secure Tutoring
Interactive Online Tutoring
After School Tutoring
Elementary School Tutoring
Middle School Tutoring
High School Tutoring
Home Work Help
Math Tutors New York City
Press
©2022 eTutorWorld Terms of use Privacy Policy Site by Little Red Bird
©2022 eTutorWorld
Terms of use
Privacy Policy
Site by Little Red Bird